-
United Kingdom+44 (20) 4577-20-00
-
USA+1 (929) 431-18-18
-
Israel+972 (55) 507-70-81
-
Brazil+55 (61) 3772-18-88
-
Canada+1 (416) 850-13-33
-
Czech Republic+420 (736) 353-668
-
Estonia+372 (53) 683-380
-
Greece+30 (800) 000-02-04
-
Ireland+353 (1) 699-43-88
-
Iceland+354 (53) 952-99
-
Lithuania+370 (700) 660-08
-
Netherlands+31 (970) 1027-77-87
-
Portugal+351 (800) 180-09-04
-
Romania+40 (376) 300-641
-
Sweden+46 (79) 008-11-99
-
Slovakia+421 (2) 333-004-23
-
Switzerland+41 (22) 508-77-76
-
Moldova+373 (699) 33-1-22
 English
Configuring Xdebug in PHPStorm
- Main
- Knowledge base
- Configuring Xdebug in PHPStorm
One of the most important processes in programming is debugging. With the help of a debugger you can see what is happening in the program, what functions are executed, what is stored in variables, as well as execute everything step by step and understand exactly on what line and at what values of variables an error occurs.
For example, the Xdebug debugger is used for PHP, PHPStorm is one of the most popular development environments. Next, let's see how to configure Xdebug in PhpStorm for debugging on local computer and in Docker.
Configuring XDEBUG in PHPSTORM
Let's talk about how debugging is done on the local server.
Let's look at the whole process using Ubuntu and the PHP interpreter configured with Apache as an example. For other configurations the file paths may be different, but the essence does not change. The Xdebug debugger allows you to pause code execution, view the call stack and the contents of variables. Its only disadvantage is that there is no convenient control interface. IDEs are usually used to control debugging. But IDE cannot tell the debugger to start debugging because it is responsible only for the code. For this purpose you will need Debug Helper browser extension, with the help of which you can enable debugging mode.
First you need to install Xdebug. To do this, execute:
$ sudo apt install xdebugOnce the Xdebug installation process is complete, you should configure the program so that when you start a debugging session, it tries to connect to our IDE to control debugging. To do this, add these lines to the /etc/php/7.4/apache2/conf.d/20-xdebug.ini file in the Xdebug 2 version:
$ sudo vi /etc/php/7.4/apache2/conf.d/20-xdebug.ini
zend_extension=xdebug.so
xdebug.remote_enable=1
xdebug.remote_host=127.0.0.1
xdebug.remote_connect_back=1
xdebug.remote_port=9000
xdebug.remote_handler=dbgp
xdebug.remote_mode=req
xdebug.remote_autostart=false
For a newer version, it is best to use a different format:
xdebug.mode=debug
xdebug.start_with_request=trigger
xdebug.discover_client_host = false
xdebug.client_host = 127.0.0.1
xdebug.client_port = 9000
Let's take a closer look at the settings. The first parameter xdebug.mode - debugging mode, possible options are:
-
develop- enables output of additional information, overrides var_dump; -
debug- mode of line-by-line code execution, it is the mode we need in this case; -
profile-profiling; -
trace-tracingof program execution.
Several modes are included at the same time when enumerating through commas. The second line xdebug.start_with_request defines how the debugger will be started for debug, trace and similar modes:
- yes - always, when running php scripts;
- no - start only from code using special functions;
- trigger - on request, using a special variable in $_ENV, $_POST, $COOKIE or other array. This option fits best in this case so that the debugger does not run when it is not necessary.
The third xdebug.discover_client_host is set to true, in which case xdebug tries to connect to the host passed in the HTTP_X_FORWARDED_FOR header. Since the host is specified in the next line, this feature is not needed in this case. Next, the client host to connect to for debugging control is 127.0.0.1 and port 9000. This is the default port used in PhpStorm at the moment. After saving the settings, you need to reboot Apache using a special command:
$ sudo systemctl restart apache2Next, you should configure PhpStorm. Start the program, then open the Run -> Edit Configurations menu. You will see a window where you need to configure the debugger.

Click the + button and select PHP Remote Debugger in the list that opens:
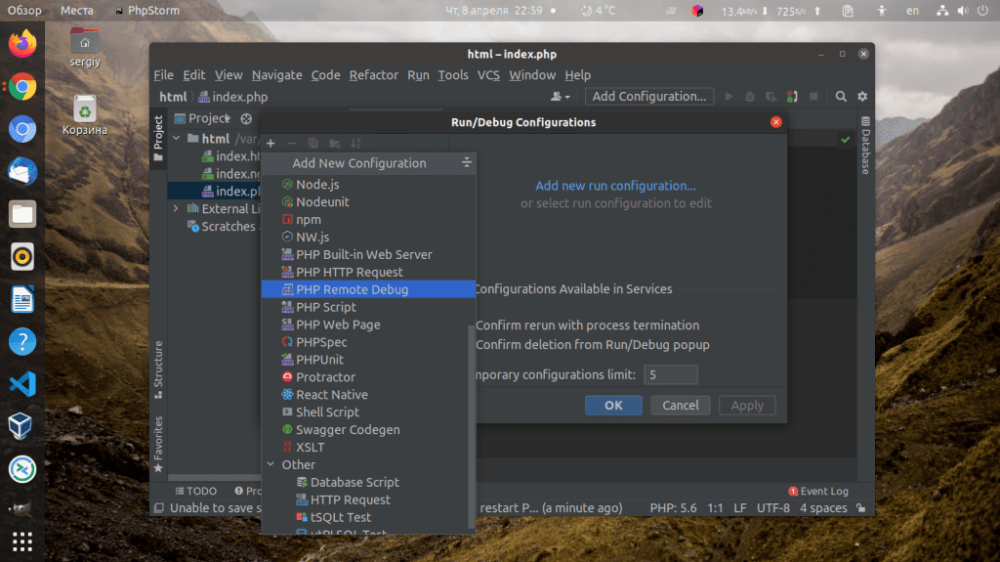
Don't change anything in the settings, just specify the name of this debugging method. If you do not specify the server from which connections will be expected, all connections will be accepted.
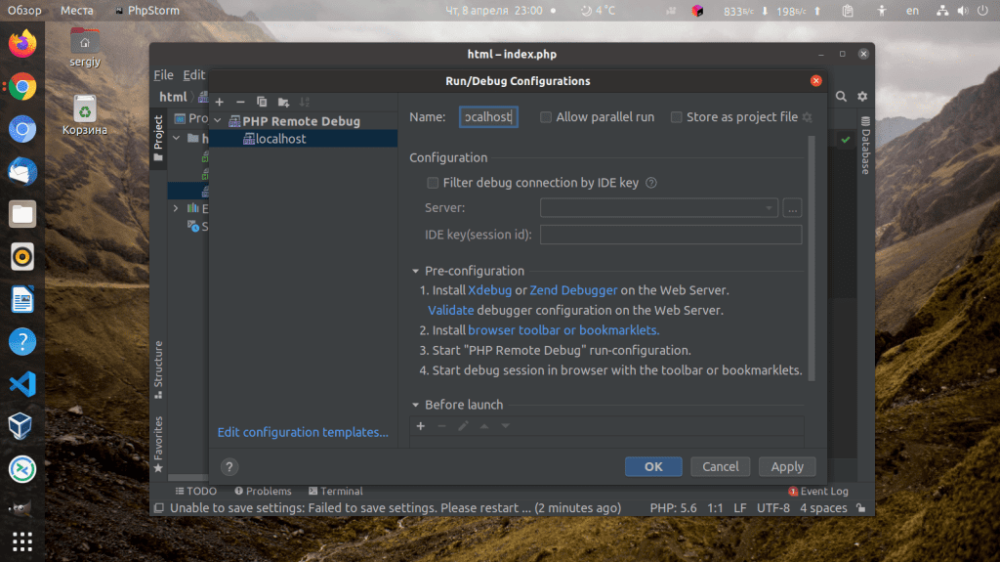
If you want to change the port to which Xdebug will connect, open File -> Settings -> PHP -> Debug -> DBGp Proxy. Here you can specify the desired port.

We can say that now the IDE is ready. Now click on the bug on the top toolbar. The program will start waiting for the debugger to connect and we'll put some breakpoints in the code just by clicking in front of the line with the code:
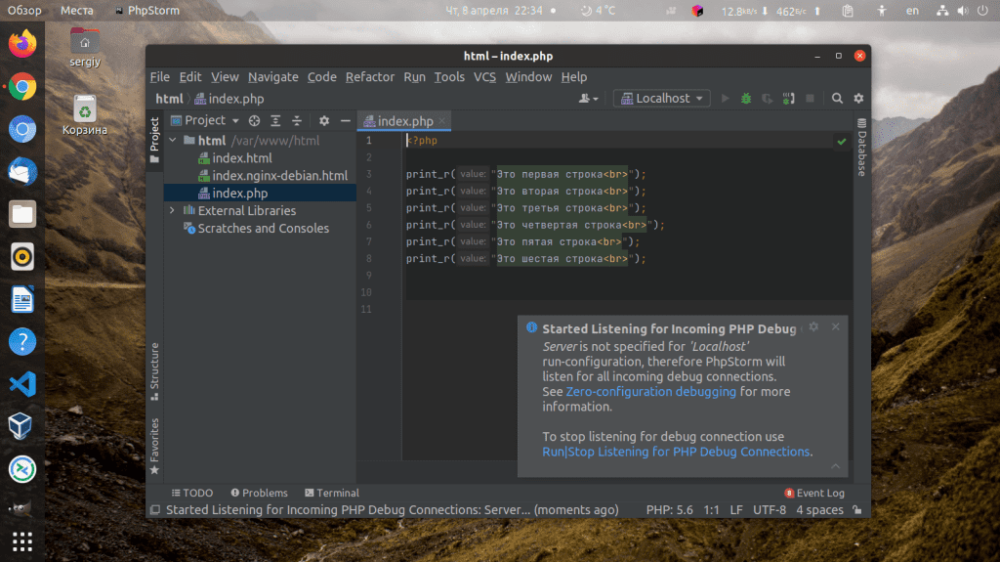
Now all that remains is to customize the browser. For Chrome, you can downloada special extension. Install it and open the page you want to debug. Click on the extension icon and select Debug. The extension icon will turn green:

Refresh the page and go back to PHPStorm. If everything was done correctly, a debugging session will start there. On the first run, the program may ask you to configure local file paths to match remote file paths. For a local server, you don't need to configure anything here, just click Accept:

After that, the debugger will stop execution at the selected breakpoint and the debugging interface will appear in the program:

Now let's understand how to configure Xdebug PhpStorm and Docker.
Debugging PHP in DOCKER
Docker can be a bit tricky. Since the debugger has to connect to the IDE itself, you need to forward the host to the container. On Windows, this can be done using the address host.docker.internal. But in Linux, this does not happen by default. To add such an address you need to add the following lines to docker-compose:
extra_hosts:
host.docker.internal: host-gateway
We use the following directory structure:

The minimum required docker-compose.yaml will look like this:
version: '3.5'
networks:
  losst-network:
services:
  nginx:
    image: nginx
    ports:
        - '8094:80'
    volumes:
        - ./www/:/var/www/
        - ./conf/nginx:/etc/nginx/conf.d
    networks:
        - losst-network
  php-fpm:
    build:
      context: ./conf/php-fpm
    extra_hosts:
      host.docker.internal: host-gateway
    volumes:
      - ./www:/var/www/
    networks:
      - losst-network
We simply declare two containers, nginx and php-fpm. We don't make any changes to the first one, so we can just take the official image, mount the source folder, the configuration file and port forward. In the second container it is necessary to install and configure Xdebug, so it will have to be built on the basis of the official php container. For the same container it is necessary to specify the extra_hosts directive, without it nothing will work. Nginx configuration is also quite standard:
server {
  listen 80;
  server_name _ !default;
  root /var/www/;
  add_header X-Frame-Options "SAMEORIGIN";
  add_header X-XSS-Protection "1; mode=block";
  add_header X-Content-Type-Options "nosniff";
  index index.html index.htm index.php;
  charset utf-8;
  location / {
    try_files $uri $uri/ /index.php?$query_string;
  }
  error_page 404 /index.php;
  location ~ .php$ {
    fastcgi_pass php-fpm:9000;
    fastcgi_index index.php;
    fastcgi_param SCRIPT_FILENAME $realpath_root$fastcgi_script_name;
    include fastcgi_params;
  }
}
This is how you configure PHP scripts processing in php-fpm container, and redirect non-existent URLs to index.php, which is quite standard for many frameworks and CMS. In the Dockerfile of the php-fpm container, it looks like this:
Install xdebug using pecl, and then copy its config file into the container. File:
xdebug.mode=debug
xdebug.start_with_request=trigger
xdebug.discover_client_host = false
xdebug.client_host = host.docker.internal
xdebug.client_port = 9000
Xdebug 3 for PHP 8 is installed in the container, because the old version doesn't work with this version of the language anymore, so the new configuration syntax is used. Well host, host.docker.internal, which used to be prescribed in docker-compose.yaml. The configuration of xdebug PHPStorm docker is now complete. Next, you can run the project:
docker-compose up --buildNow, as in the previous option you can enable debug mode in the browser, refresh the page and the debugger will successfully connect to the IDE, despite the fact that it is running in Docker


