top shows load average: 4.21, 3.87, 2.15 — and it is unclear whether this is a disaster or normal operation. The answer depends on core count. And on what is actually generating the load — CPU or I/O. These are different problems with different solutions.
Three Numbers — Three Time Horizons
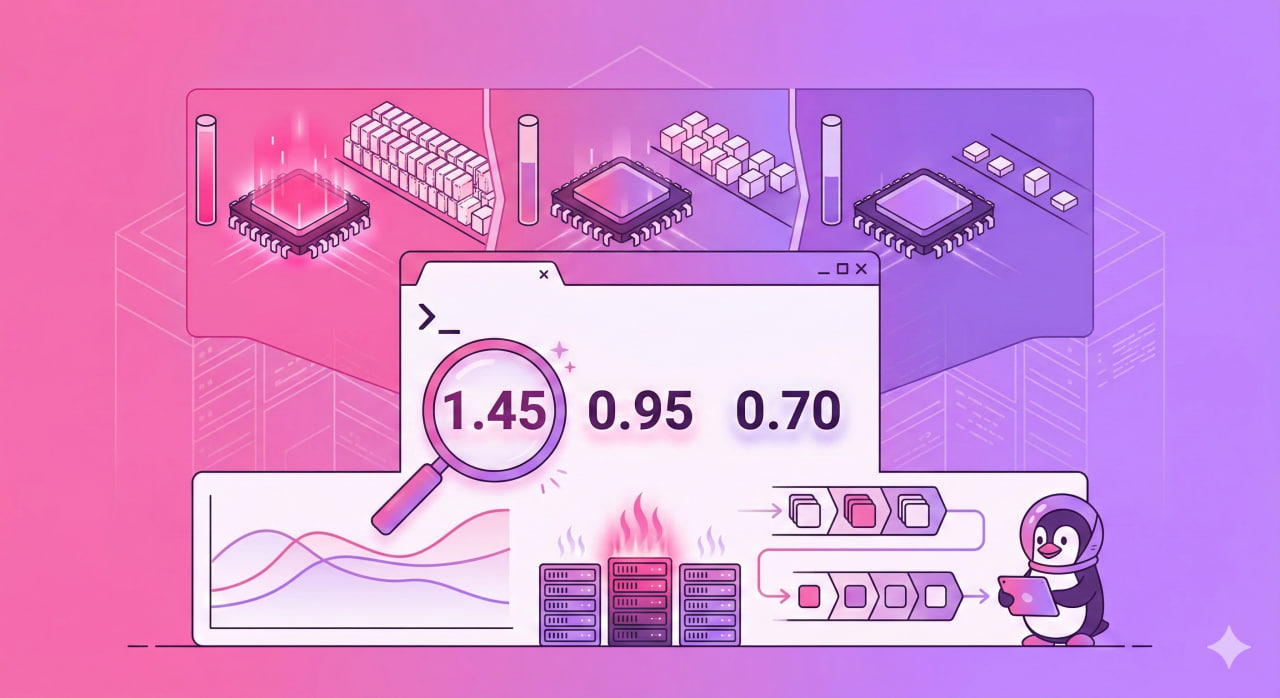
uptime and the first line of top show three values:
uptime
The numbers left to right — average load over 1 minute, 5 minutes, and 15 minutes. Not current load — an average over the period.
Read them in reverse: 15 minutes first, then 5, then 1. This shows the trend:
1.85 → 2.10 → 3.40 — load is dropping. The peak was 15 minutes ago, things are improving now.
3.40 → 2.10 → 1.85 — load is climbing. Just getting started.
2.10 ≈ 2.10 ≈ 2.10 — load is stable. System is in a steady state.
What 1.0 Means in LA Units
One unit of LA means one process continuously occupying one CPU core. On a 4-core server:
- LA = 4.0 — all cores at 100%, no queue. Normal.
- LA = 2.0 — half the cores busy. Room to spare.
- LA = 8.0 — queue is twice the throughput capacity. Problem.
Normal LA formula: number of cores × 0.7–1.0
Check core count:
nproc
Calculate LA per core in the terminal:
echo "scale=2; $(uptime | awk '{print $(NF-2)}' | tr -d ',') / $(nproc)" | bc
A value above 1.0 means cores cannot keep up and processes are queuing.
What LA Actually Counts: Not Just CPU
The main misconception about Load Average is that it measures CPU utilization. It does not. LA counts all processes in two states:
R (Running/Runnable) — processes that are executing or ready to execute and waiting for CPU.
D (Disk sleep / Uninterruptible sleep) — processes blocked waiting for I/O: disk reads, network responses, NFS. They cannot be interrupted by signals.
This is critical: high LA with low CPU usage means a disk I/O or network problem, not a CPU problem. Two completely different situations requiring different fixes.
Reading Data From /proc/loadavg
/proc/loadavg is the original source for all utilities:
cat /proc/loadavg
1.85 2.10 3.40 2/487 29341
First three numbers — LA over 1/5/15 minutes. The fourth field 2/487 — how many processes are currently active out of total. The fifth — PID of the last created process.
Diagnostic Tools: Finding the Culprit
Check CPU load separately from I/O:
vmstat 1 5
The wa column — percentage of time spent waiting for I/O. High wa with high LA means disk or network problems, not CPU.
Find D-state processes (stuck in I/O):
ps aux | awk '$8 ~ /^D/ {print $0}'
Many such processes means the disk or NFS is not keeping up.
top with per-core breakdown — press 1 inside top:
top
LA history with timestamps via sar:
sudo apt install sysstat
sar -q 1 5
Normal Values: Reference Points
| Situation | LA Per Core | Assessment |
|---|---|---|
| Server idle | < 0.1 | No load |
| Normal operation | 0.1 – 0.7 | Good |
| High load | 0.7 – 1.0 | Acceptable |
| Queue building | > 1.0 | Needs attention |
| Server overloaded | > 2.0 | Problem |
Brief spikes above 1.0 are normal. The problem starts when the 15-minute value consistently exceeds core count.
Common Causes of High LA
High LA + high %CPU: a script or process is consuming cores. Find with top or:
ps aux --sort=-%cpu | head -10
High LA + low %CPU + high %wa in vmstat: I/O problem. Check disk:
iostat -x 1 5
The %util column near 100% means the disk is saturated.
High LA + many D-state processes + NFS mounted: the network filesystem is not responding. Check:
df -h
mount | grep nfs
Quick Reference
| Task | Command |
|---|---|
| Current LA | uptime |
| LA from source | cat /proc/loadavg |
| Core count | nproc |
| I/O wait (cause of LA?) | vmstat 1 5 — check wa column |
| Per-core breakdown | top, then press 1 |
| D-state processes | ps aux | awk '$8 ~ /^D/ {print $0}' |
| LA history | sar -q 1 5 |
| Disk utilization | iostat -x 1 5 |
| Top CPU processes | ps aux --sort=-%cpu | head -10 |