
Linux does not show component temperatures in the system tray out of the box — unlike Windows. But there are significantly more monitoring tools available: from a single terminal command to graphical dashboards with history and notifications.
CPU Temperature via lm-sensors
lm-sensors is the standard set of utilities for reading hardware sensor data. It reads CPU temperature, motherboard, GPU (via NVIDIA/AMD drivers), and voltage levels.
Installation
sudo apt install lm-sensors hddtemp   # Debian/Ubuntu
sudo dnf install lm_sensors hddtemp  # Fedora/RHEL
sudo pacman -S lm_sensors             # Arch Linux
Initial Setup
Before first use, run the sensor detection wizard:
sudo sensors-detect
Answer Y to all questions — the utility will scan i2c/SMBus buses, detect sensors, and identify the appropriate kernel modules.
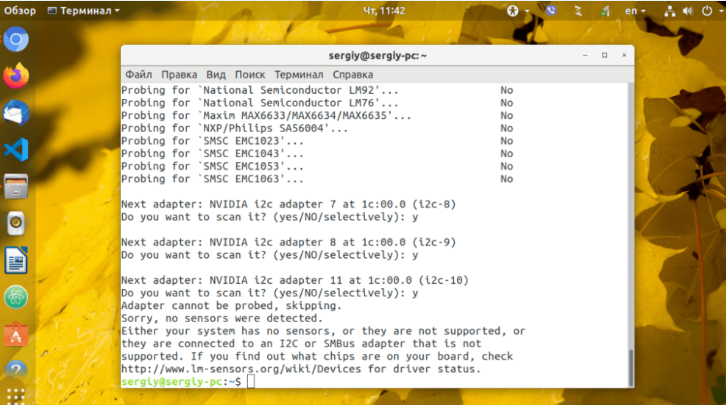
At the end the wizard will offer to add the found modules to autoload — accept. Then load modules without rebooting:
sudo systemctl restart kmod
Or reboot the system.
Read Sensor Data
sensors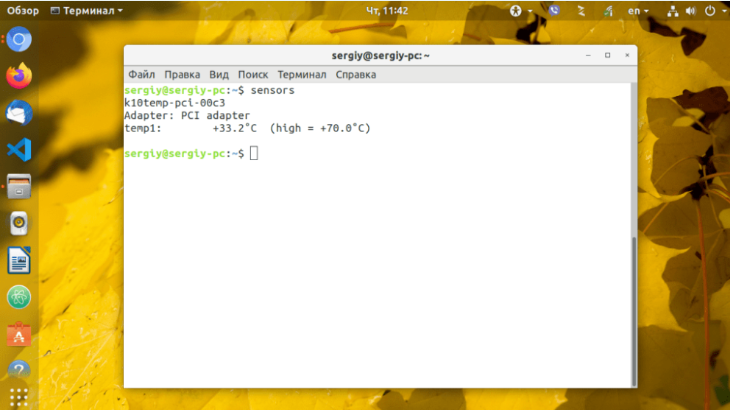
Typical output for an AMD system:
k10temp-pci-00c3
Adapter: PCI adapter
Tctl:         +44.0°C
Tdie:         +44.0°C
Tccd1:        +40.2°C

nvme-pci-0200
Adapter: PCI adapter
Composite:    +37.9°C  (high = +84.8°C, crit = +94.8°C)
Label meanings:
Tctl— controller temperature (may read 10–27°C higher on Ryzen, this is normal)Tdie— actual die temperatureTccd1/Tccd2— chiplet temperatures (multi-die Ryzen CPUs)high— warning thresholdcrit— critical threshold above which throttling begins
Continuous terminal monitoring:
watch -n 1 sensors
The watch -n 1 command refreshes output every second. Useful during stress testing — shows temperature rising in real time.
Disk Temperature via hddtemp and smartctl
hddtemp
sudo hddtemp /dev/sda
/dev/sda: WDC WD10EZEX: 34°C
For multiple disks at once:
sudo hddtemp /dev/sd?
smartctl (more reliable method)
smartctl from the smartmontools package reads disk SMART data including temperature:
sudo apt install smartmontools
sudo smartctl -A /dev/sda | grep -i temp
For an NVMe drive:
sudo smartctl -A /dev/nvme0 | grep -i temp
Temperature via sysfs (No Utilities Required)
The Linux kernel exports sensor data through the virtual filesystem /sys. It can be read directly — without installing any additional packages.
List available temperature sensors:
find /sys/class/thermal -name "temp" -o -name "temp_input" 2>/dev/null
Read temperature (value in millidegrees):
cat /sys/class/thermal/thermal_zone0/temp
Output 44000 means 44°C. Convert to readable format:
awk '{printf "%.1f°C\n", $1/1000}' /sys/class/thermal/thermal_zone0/temp
View all zones at once:
for zone in /sys/class/thermal/thermal_zone*/; do
  type=$(cat "${zone}type" 2>/dev/null)
  temp=$(awk '{printf "%.1f°C", $1/1000}' "${zone}temp" 2>/dev/null)
  echo "$type: $temp"
done
GPU Temperature
NVIDIA
nvidia-smi --query-gpu=temperature.gpu --format=csv,noheader
Or with additional data:
nvidia-smi --query-gpu=name,temperature.gpu,fan.speed,power.draw --format=csv
Continuous GPU monitoring every 2 seconds:
watch -n 2 nvidia-smi --query-gpu=name,temperature.gpu --format=csv
AMD
sensors | grep -i "edge\|junction\|mem"
Or use radeontop for detailed monitoring.
Graphical Monitoring via psensor
psensor is a GUI application with graphs, history, and notifications. It runs on top of lm-sensors.
Installation
sudo apt install psensor
Launch
psensors
Or from the system application menu.
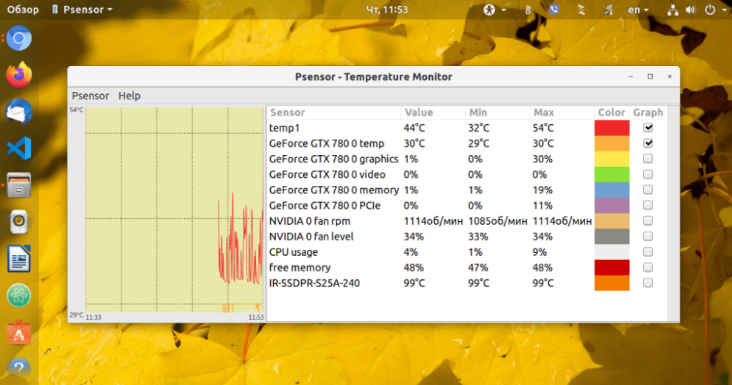
The main window shows a table of all sensors with current, minimum, and maximum values. On the right — color-coded real-time graphs. Checkboxes control which sensors appear on the graph.
Setting Thresholds and Notifications
Double-click a sensor → Alarm tab — set thresholds.
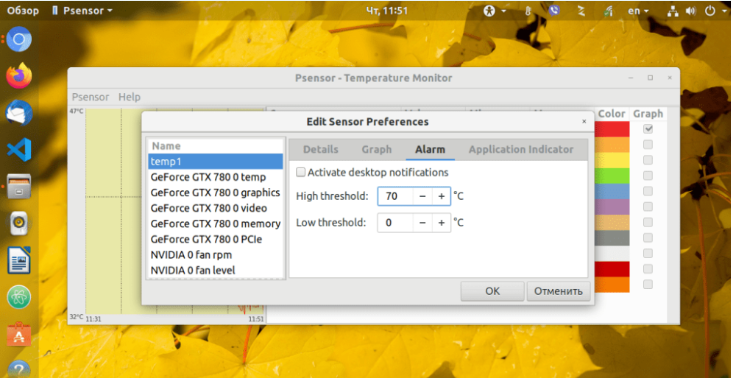
When a threshold is reached, psensor shows a desktop notification. Useful during long computations or rendering — no need to keep watching the terminal.
Running psensor in the System Tray
Launch minimized to tray:
psensors --hide-window
Add to autostart: System Settings → Startup Applications → add psensors --hide-window.
Temperature Reference Values
| Component | Normal (idle) | Normal (load) | Critical |
|---|---|---|---|
| CPU (Intel) | 30–45°C | 65–85°C | >95°C |
| CPU (AMD Ryzen) | 35–50°C | 70–90°C | >95°C |
| GPU | 30–50°C | 65–85°C | >95°C |
| HDD | 25–40°C | up to 50°C | >55°C |
| NVMe SSD | 35–55°C | up to 70°C | >80°C |
The Tctl value on Ryzen CPUs may read 10–27°C above actual temperature — this is an architectural feature, not overheating.
Quick Reference
| Task | Command |
|---|---|
| Initial sensor setup | sudo sensors-detect |
| Show all temperatures | sensors |
| Real-time monitoring | watch -n 1 sensors |
| Disk temperature | sudo hddtemp /dev/sda |
| NVMe temperature via SMART | sudo smartctl -A /dev/nvme0 | grep -i temp |
| GPU temperature (NVIDIA) | nvidia-smi --query-gpu=temperature.gpu --format=csv,noheader |
| Read from sysfs directly | cat /sys/class/thermal/thermal_zone0/temp |
| Graphical monitor | psensors |